


link to open access paper https://onlinelibrary.wiley.com/doi/10.1111/gcb.71050
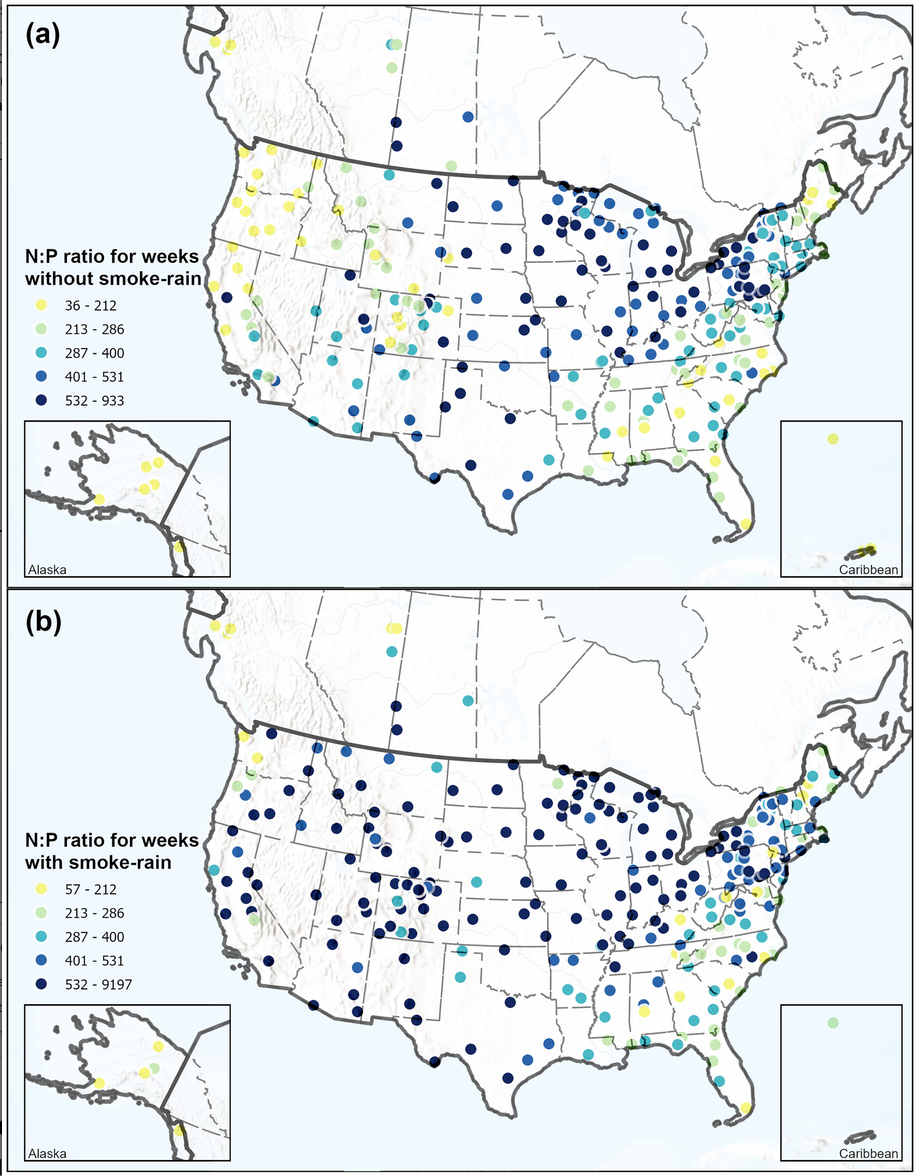
Figure 6: Weekly molar N:P ratios (exponentiated) of atmospheric wet deposition at NADP sites during (a) weeks without smoke-rain days, and (b) weeks with smoke-rain days. Map lines delineate study areas and do not necessarily depict accepted national boundaries.
Good?